Ethnography As Strategy
LESSONS LEARNED
Research can be used to build bridges and align organizations. A well-executed ethnographic research effort brings a solid baseline of fact to previously fuzzy conversations about complexity and prioritization that ultimately affect business strategy and outcomes.
The Opportunity And Hypothesis
Even though the 17 powerful Condé Nast brands are all under the umbrella of Condé Nast, they are dealt with as unique and singular businesses. Further increasing the fragmentation of separate companies under one roof; within the brands, the print, digital, and digital editions are handled as discrete divisions. This organizational structure often led to the development of individual software solutions on a per brand and even on a per publication channel basis.
If we were to bring all the brands onto a single CMS platform, the internal software teams could then take advantage of what is called “the network effect”. The network effect in this case means we could build a feature within the CMS once and ship it to all the brands simultaneously.
How might we:
"How might we, as a design and research team, qualify a set of common needs across the brands such that we can reasonably move them all onto the same platform?"
Hypothesis:
We believed that a rigorous research effort spanning all digital publications not yet on the platform would reveal the deeply common processes, stages, and steps shared by ALL the brands. And if that research was meaningfully applied it would accurately guide current and future software development. Moreover if that research was couched correctly and shared back to the brands it would increase trust between the software product teams and the brands.
The Challenge(s) Overcome
The general perception of the platform teams
At the time, the current in house CMS was in a state where the feature set was comprehensive for all main cases and needs, but, truly unique customization was challenging. The brands who were on the platform made use of the system as it was but the brands not yet on the platform perceived the in house CMS as less than optimal for their businesses.
The complexity of maintaining complexity
The need to maintain multiple platforms at a woefully inadequate internal team size was untenable. Often we were forced to make hard choices regarding prioritization which conflicted with brand timelines. This led to the perception of the internal product design and engineering teams as being out of touch and unable to meaningfully support the brands at the speed they needed.
“You’ll break our business”
The current state of the internal CMS was such that some of the brands were pushing back against the idea of a unified publishing platform. Their reasoning is that their publishing process was their "special sauce" and if we were to move them onto the same platform (and functionally a unified publication process) we would damage their business.
Scope of interviews
For this effort to be successful, we needed to cover a lot of ground in a very short period of time. There was pressure to have all the brands on the same platform in the next 9 months which meant we needed to ship a research summary in 2 months. This sounds reasonable until considering the scope of 80 in-depth interviews across nearly 10 businesses, summarized, designed, and socialized within that 2-month time frame.
Let the games begin.
The Players
LEADERSHIP
The CTO linked me to the CFO of the entire company. This level of sponsorship was critical when we were being blocked by politics and the funding was critical to success.
RESEARCH
We had a severely tight timeline to gather info, and we were dealing with exceptionally busy people. The hack of "System design blueprinting" was the cornerstone of our ability to succeed.
DESIGN
The summaries and readouts were tightly crafted and polished. We were presenting these findings to people who cared very much about how it looks and design made sure the message was not diminished due to aesthetics.
The Process
We began by interviewing the managing editors at each brand to understand their current workflow processes and to develop a list of interviewees for future sessions. Once we had coverage and started to see repeat patterns within the suggested interviewees we developed an org chart for the interview scheduling and started to explore possible research methods that would enable us to capture the right amount of depth for this effort to succeed.
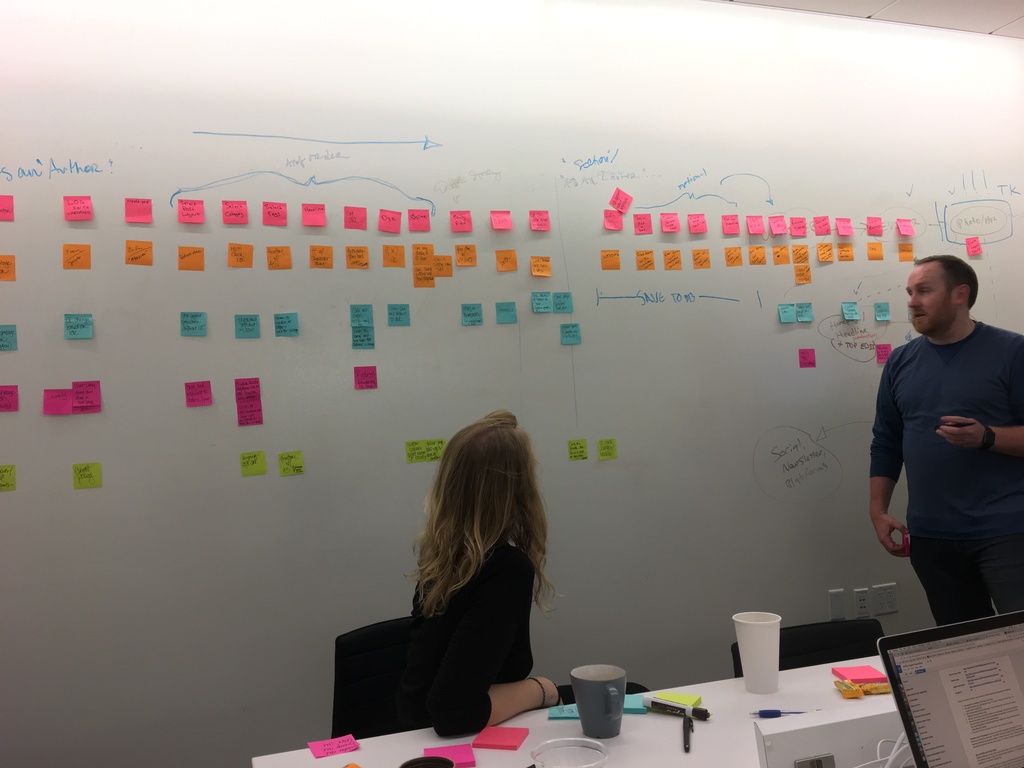
An info gathering and blueprinting session at Wired.
It became obvious early on that a stripped-down form of service blueprinting would be the best method. It would give us a repeatable framework that would support the possibility of quantifying repeated events and or tools such that we could show density or frequency of use. Service blueprinting as a method could be simplified into a spreadsheet. Rows used as swim lanes for various processes in relation to columns that would record steps within the workflows. Stripped back even further this method can be executed in a research session as post-its on a whiteboard. It seemed to be the right approach for the speed and density of gathering we needed.
Once we had tested the method with allies within one of the brands and we were confident it would scale we brought in 3 contractors to help us capture the data. The sessions were composed of a stakeholder representing each part of the business, a facilitator, and a researcher taking notes. For instance, in the room for a workshop, we would have representatives from the editorial team, photo editorial team, their internal product manager, and their engineering team. Together they would describe each step of their production process, and if possible speak to each swim lane under each step. These workshops were conducted across all brands not yet on the platform. We then conducted any follow on interviews to clarify captured info that was unclear or needed to be expanded.
When we had completed the data capture phase we summarized and normalized the nomenclature for the steps across the brands. With this normalized set of step names, we shared it back to all the brands for their review and ideally, agreement. By the end of this step, we had 100% buy-in from all the brands as to the nomenclature for each of the steps within their workflow. In short, we had our foot in the door to generate consensus between the brands as to their processes. Armed with a common set of terms for each step we could then take the descriptions of those steps and normalize those as well. That evening, we went for a celebratory drink.
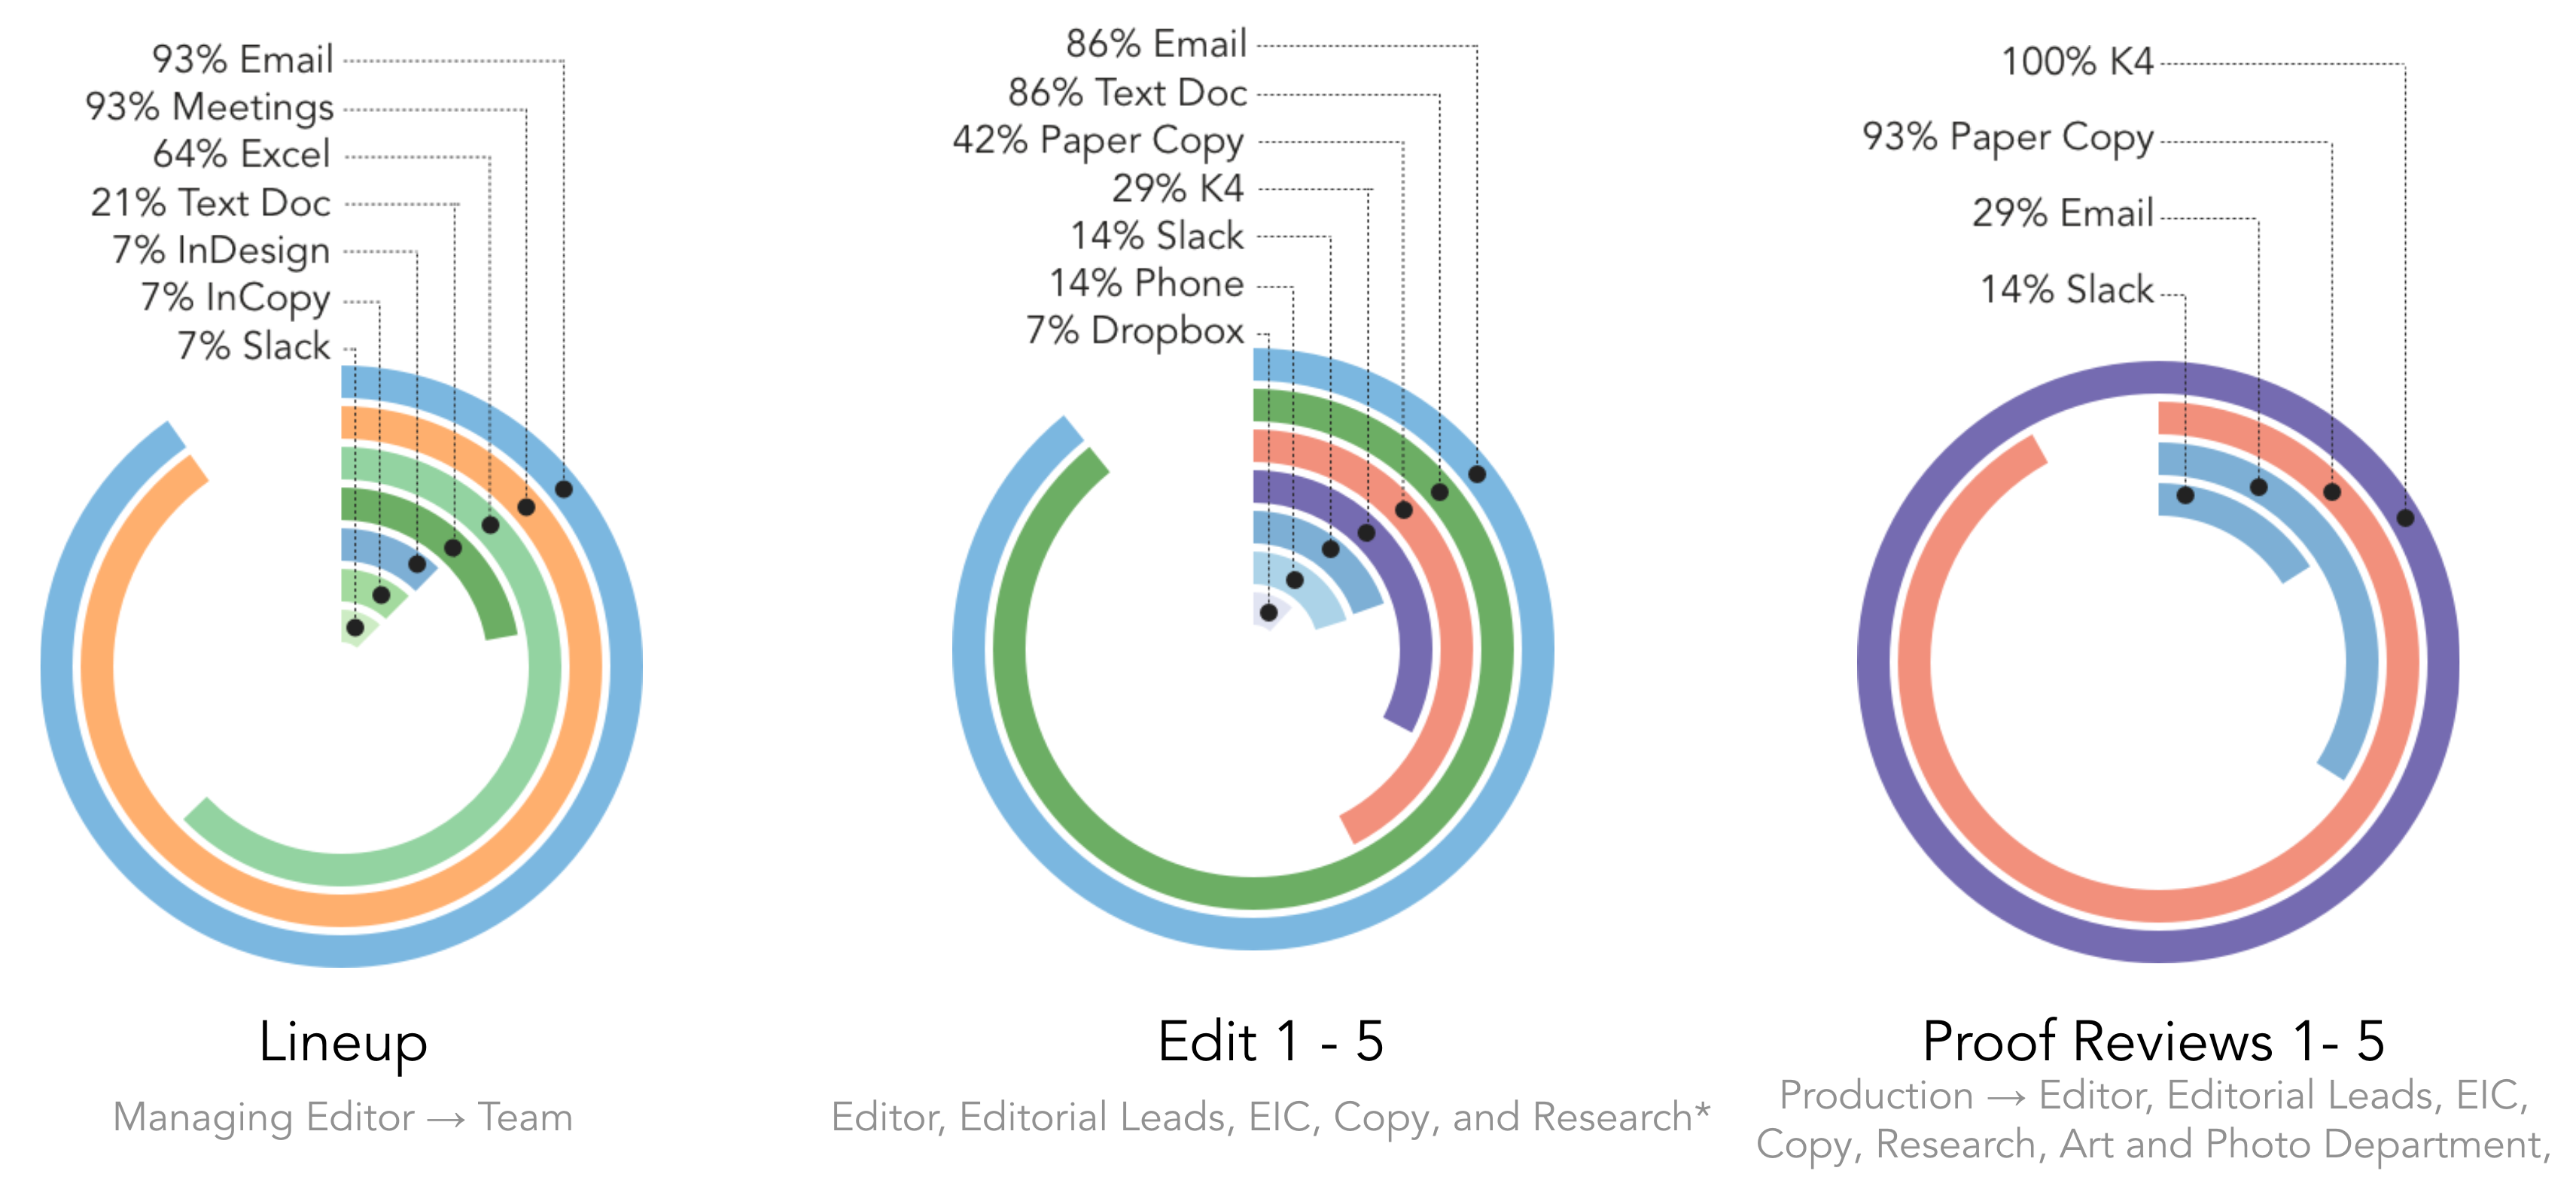
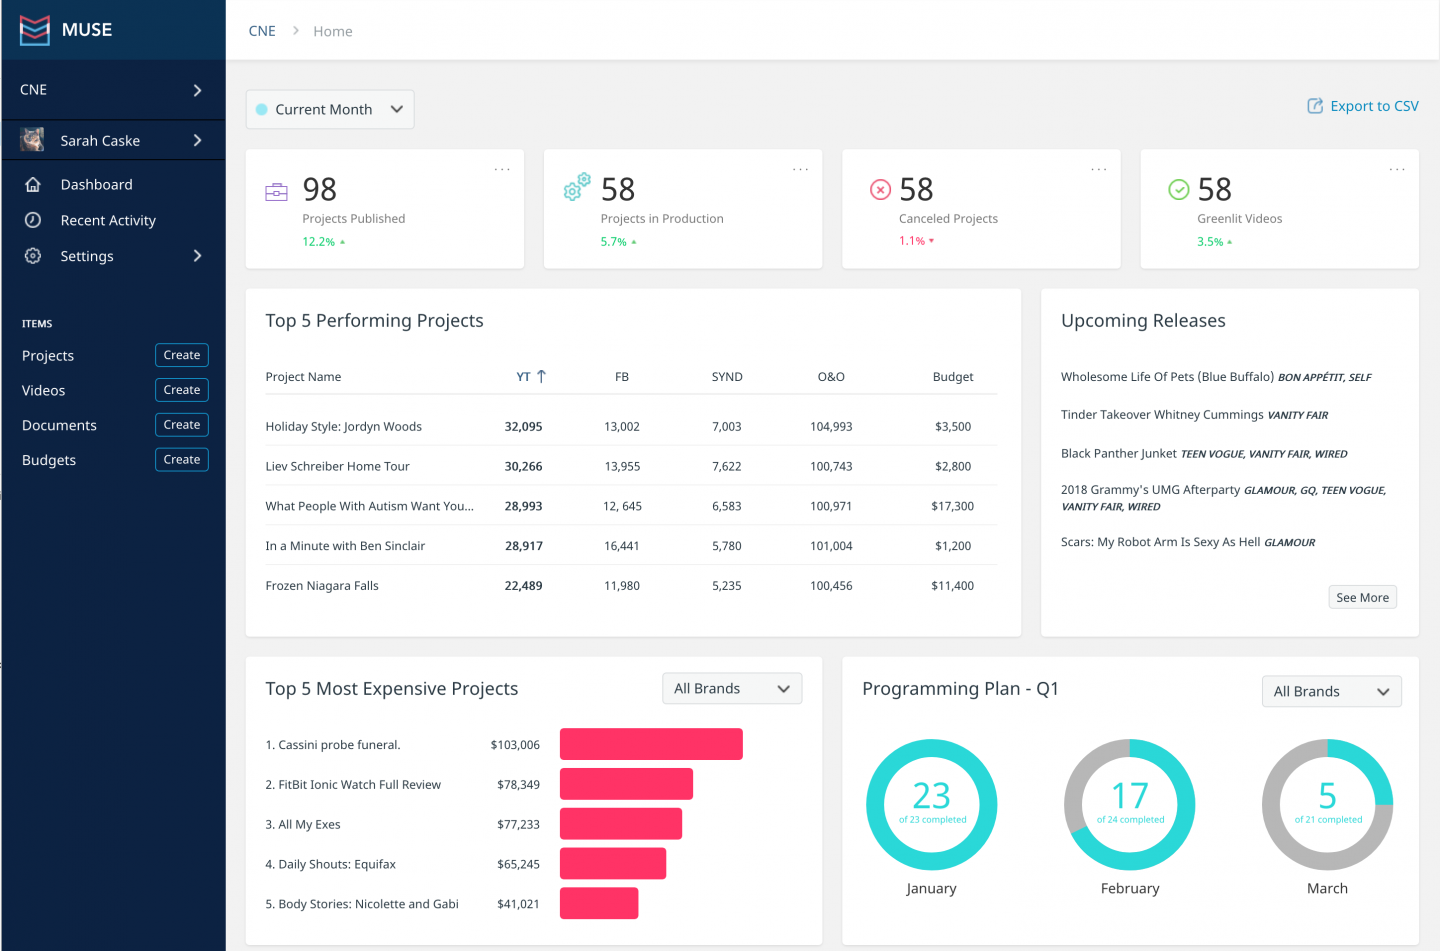
An image of an example of tool usage by event.
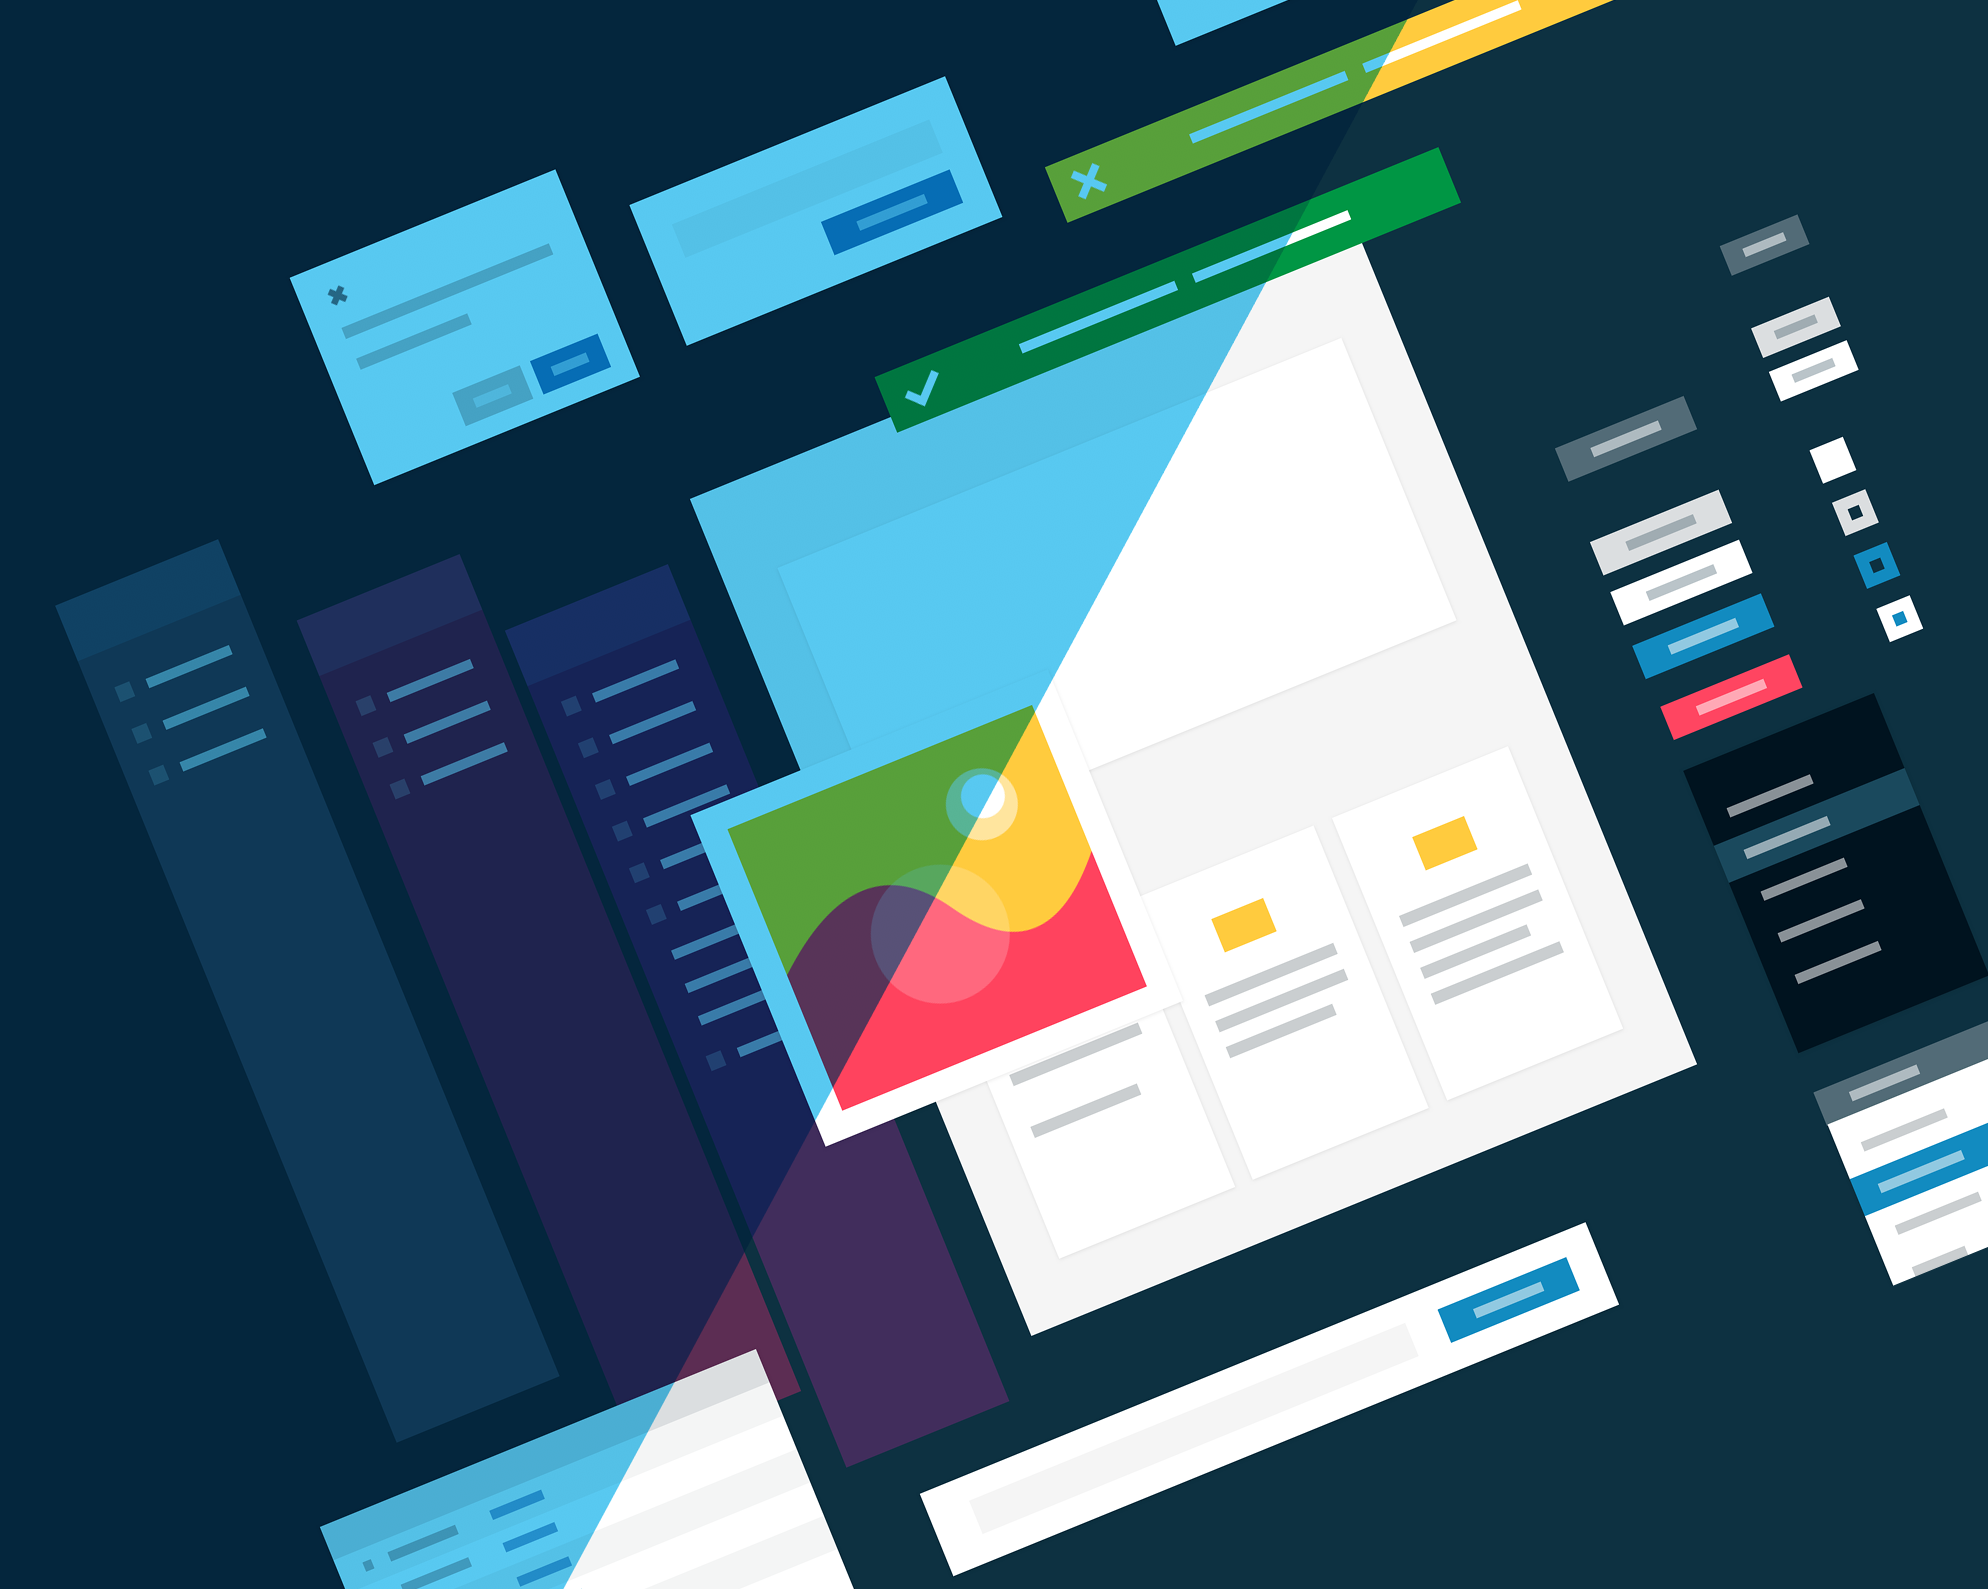
The next very important step was summarizing the events and tool usage. Because of the way we had captured the data it was decently structured and the theory was that we could create metrics related to the number of tools being used, the density of tool usage by event, we could even know how tools were being used by event. This was very valuable insight as it would not only tell us about user needs but also software licensing costs and data security risks.
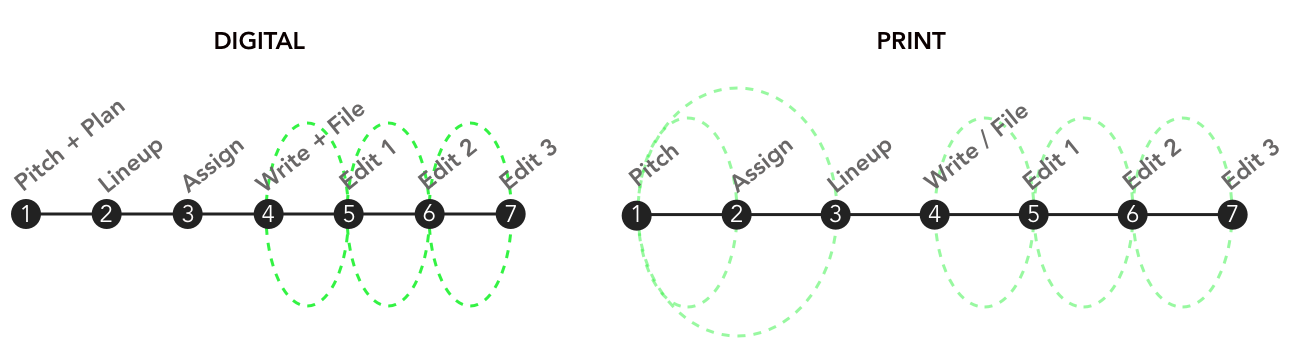
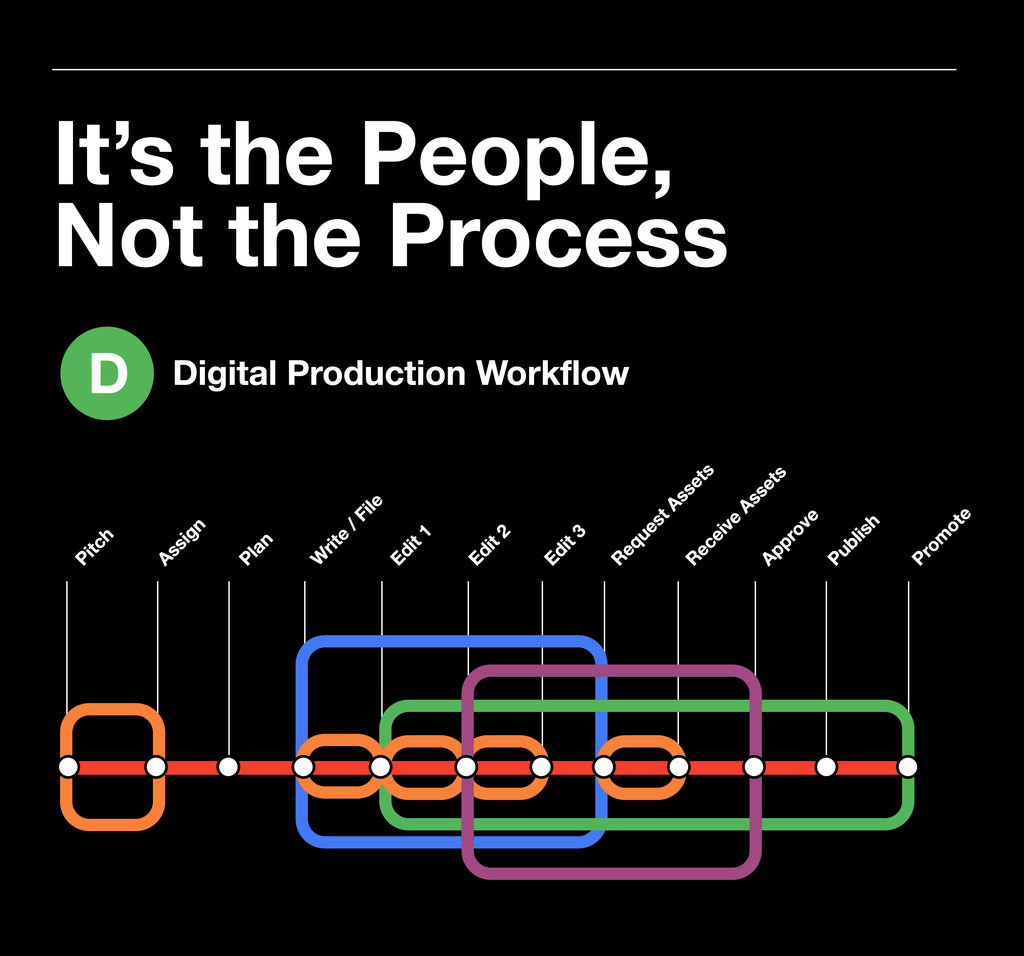
A diagram of process overlap between print and digital.
When we had summarized all the data we had captured came the trickiest part; telling the story. We knew things and could show things that were previously unknown to Condé Nast as an organization. We knew factually that the digital brands without exception, produced content the same way. We knew that there was meaningful overlap in the initial processes between print and digital. We knew what tools were being used, when they were being used, and why they were used. And we needed to share this information back to a group of businesses that up to this point had been very competitive with and secretive towards each other.
So we couched the message in the truth, it’s not the people, it’s the process. If Photoshop doesn’t dictate the outcome of use, nor would all the brands be forced to a single business profile if they were on the same platform. Photoshop is wonderful because of how it’s used. Same goes for a unified platform.
We packaged the summaries in a polished presentation and I spent the next 3 months sharing it back to the brands and executives across the company where it was widely received as meaningful insight.
The Outcome
Most importantly 100% of brands are now on the platform
The platform has been globalized and serves all Condé brands in all markets
The research method we employed (and hacked) is being re-used by the current product teams for their own research initiatives
The artifacts generated from the research effort are still used almost 2 years later as a reference and a template for updates and changes in platform needs
“Lean service blue printing” would be used to map many other complex software systems across the company such as digital rights management and digital asset management
The brands and the internal software teams now have a much better relationship